- Fisch L (1970) The selective and differential vulnerability of the auditory system. In GEW
Wolstenholm and J Knight, (Eds), Sensorineural Hearing Loss: A Ciba Foundation
Symposium (pp 101-116). London: Churchill. - Craigie EH (1920). On the relative vascularity of various parts of the central nervous system of
the albino rat. Journal of Comparative Neurology, 31, 429-464. - Craigie EH (1938). Vascularity in the brain of the frog (Rana Pipiens). Journal of Comparative
Neurology, 69, 453-479. - Landau WM, Freygang WH, Rowland LP, Sokoloff L, Kety SS (1955) The local circulation of the
living brain; values in the unanesthetized and anesthetized cat. Transactions of the American
Neurological Association 1955-1956;(80th Meeting):125-129. - Kety SS (1962) Regional neurochemistry and its application to brain function. In French, JD,
ed, Frontiers in Brain Research. New York: Columbia University Press, pp 97-120. - Kety SS (1994) The measurement of cerebral blood flow by means of inert diffusible tracers.
Keio Journal of Medicine 43:9-14. - Reivich M, Jehle J, Sokoloff L, Kety SS (1969) Measurement of regional cerebral blood flow
with antipyrine-14C in awake cats. Journal Of Applied Physiology 27:296-300. - Sakurada O, Kennedy C, Jehle J, Brown JD, Carbin GL, Sokoloff L (1978) Measurement of
local cerebral blood flow with iodo-14-C-antipyrine. American Journal of Physiology, 234, H59-
H66.
2 - Site of highest cerebral circulation
Early myelinization is a strikingly distinctive feature,
but equally remarkable have been the repeated
findings of highest metabolic rate in the auditory
system.
Metabolism is not uniform throughout the brain. The
brain can be thought of as a collection of separate
organs that participate in sensory and motor
functions. Sensory transmission systems in the
brainstem must be continually active, except possibly
during sleep. The target receptive areas in the
cerebral cortex maintain memory images of
environmental events and association tracts between
them that can be activated when needed, but may
not need to be as continually active as the circuits
that transmit information about the environment
through the senses.
As Fisch (1970) pointed out though, the auditory
system does function even during sleep [1]. This is
why alarm clocks are so useful. Maintaining
continual vigilance, the auditory system must
therefore be the most active of the sensory systems
within the brain, and this is borne out by
investigations of cerebral circulation and metabolism.
Investigations of regional differences in cerebral
circulation began with the work of Craigie (1920,
1938) who used India ink injections in laboratory rats
and frogs to map the vascular system of the brain [2,
3]. Capillary density was used as an estimate of
blood flow, and Craigie found the richest blood
supply in the cochlear nucleus and other brainstem
auditory nuclei. Use of radioactive tracers later
provided more detail and allowed permanent
photographic records of experiments to be kept.
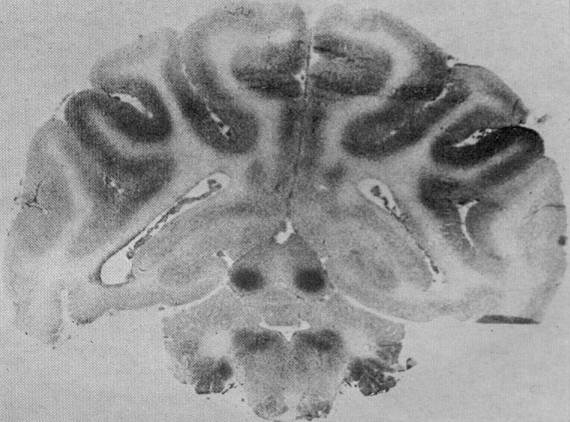
Landau et al. (1955) developed the first
autoradiographic technique for measuring blood flow
in different regions of the brain in laboratory animals
[4]. They sacrificed the animals shortly after injection
of an inert gas, trifluoroiodomethane, labeled with
radioactive Iodine-131. Slices of the brain were then
placed on photographic plates to measure density of
exposure from radioactivity. Their first experiments
were with cats and the results are given in table 3.
The inferior colliculus was found to have the highest
rate of blood flow, followed by sensory areas of the
cerebral cortex and thalamus.
Kety (1962, 1994) described how discovery of the
high rate of blood flow in the inferior colliculus came
as a surprise [5, 6]. In fact, Landau et al. (1955)
repeated their experiments with deafened animals
because they thought the noise of their equipment
had stimulated the auditory system and caused an
increase in blood flow. Even in deaf animals the
highest rate of blood flow was found in the inferior
colliculi, the superior olives, and nuclei of the lateral
lemniscal tracts, which transmit signals from the
superior olives up to the inferior colliculi.
Reivich et al. (1969) modified the autoradiographic
technique for measuring blood flow using a more
readily available radioactive tracer, carbon-14
labeled antipyrine, and the results were in good
agreement with those obtained using the tracer
containing radioactive iodine [7]. Sakurada et al.
(1978) refined the method using
iodo-14-C-antipyrine [8], and these two methods are
now most often used for measuring cerebral
circulation in laboratory animals.
Early myelinization is a strikingly distinctive feature,
but equally remarkable have been the repeated
findings of highest metabolic rate in the auditory
system.
Metabolism is not uniform throughout the brain. The
brain can be thought of as a collection of separate
organs that participate in sensory and motor
functions. Sensory transmission systems in the
brainstem must be continually active, except possibly
during sleep. The target receptive areas in the
cerebral cortex maintain memory images of
environmental events and association tracts between
them that can be activated when needed, but may
not need to be as continually active as the circuits
that transmit information about the environment
through the senses.
As Fisch (1970) pointed out though, the auditory
system does function even during sleep [1]. This is
why alarm clocks are so useful. Maintaining
continual vigilance, the auditory system must
therefore be the most active of the sensory systems
within the brain, and this is borne out by
investigations of cerebral circulation and metabolism.
Investigations of regional differences in cerebral
circulation began with the work of Craigie (1920,
1938) who used India ink injections in laboratory rats
and frogs to map the vascular system of the brain [2,
3]. Capillary density was used as an estimate of
blood flow, and Craigie found the richest blood
supply in the cochlear nucleus and other brainstem
auditory nuclei. Use of radioactive tracers later
provided more detail and allowed permanent
photographic records of experiments to be kept.
Landau et al. (1955) developed the first
autoradiographic technique for measuring blood flow
in different regions of the brain in laboratory animals
[4]. They sacrificed the animals shortly after injection
of an inert gas, trifluoroiodomethane, labeled with
radioactive Iodine-131. Slices of the brain were then
placed on photographic plates to measure density of
exposure from radioactivity. Their first experiments
were with cats and the results are given in table 3.
The inferior colliculus was found to have the highest
rate of blood flow, followed by sensory areas of the
cerebral cortex and thalamus.
Kety (1962, 1994) described how discovery of the
high rate of blood flow in the inferior colliculus came
as a surprise [5, 6]. In fact, Landau et al. (1955)
repeated their experiments with deafened animals
because they thought the noise of their equipment
had stimulated the auditory system and caused an
increase in blood flow. Even in deaf animals the
highest rate of blood flow was found in the inferior
colliculi, the superior olives, and nuclei of the lateral
lemniscal tracts, which transmit signals from the
superior olives up to the inferior colliculi.
Reivich et al. (1969) modified the autoradiographic
technique for measuring blood flow using a more
readily available radioactive tracer, carbon-14
labeled antipyrine, and the results were in good
agreement with those obtained using the tracer
containing radioactive iodine [7]. Sakurada et al.
(1978) refined the method using
iodo-14-C-antipyrine [8], and these two methods are
now most often used for measuring cerebral
circulation in laboratory animals.
- Fisch L (1970) The selective
and differential vulnerability of
the auditory system. - Craigie EH (1920). On the
relative vascularity of various
parts of the central nervous
system of the albino rat. - Craigie EH (1938).
Vascularity in the brain of the
frog (Rana Pipiens). - Landau WM et al. (1955) The
local circulation of the living
brain; values in the
unanesthetized and
anesthetized cat. - Kety SS (1962) Regional
neurochemistry and its
application to brain function. - Kety SS (1994) The
measurement of cerebral
blood flow by means of inert
diffusible tracers. - Reivich M et al. (1969)
Measurement of regional
cerebral blood flow with
antipyrine-14C in awake cats. - Sakurada O et al. (1978)
Measurement of local
cerebral blood flow with iodo-
14-C-antipyrine.
| Cerebral Blood Flow in Cats |
| Brain Structure | cc/gm/min | Brain System |
|---|---|---|
| Inferior colliculus | 1.80 | auditory |
| Sensory-motor cortex | 1.38 | |
| Auditory cortex | 1.30 | |
| Visual cortex | 1.25 | |
| Medial geniculate | 1.22 | auditory |
| Lateral geniculate | 1.21 | visual |
| Superior colliculus | 1.15 | visual |
| Caudate | 1.10 | subcortical motor |
| Thalamus | 1.03 | |
| Association cortex | 0.88 | |
| Cerebellar nuclei | 0.87 | |
| Cerebellar white matter | 0.24 | |
| Cerebral white matter | 0.23 | |
| Spinal cord white matter | 0.14 |
- Cerebral blood flow in cats
flow in the brain of a monkey. From Myers (1972) |