Speech understanding
Subjects & tests
Predicted results
Hypotheses & rationale

References
Auditory agnosia
Asphyxia at birth
Human infants
Functional MRI
Presbyacusis
Fetal alcohol syndrome
fMRI of language processing
Trophic transmitters
Longterm outcome
Myelin maturation
Learning to speak
Kanner autism
Metabolism in the brain
Vasodilation response
The Bohr effect
Circulatory arrest
Brainstem damage
Thiamine deficiency
Autism & prenatal alcohol
Autism & valproic acid
Autism & infections
Autism & PKU
Autism & genetic disorders
Autism & medical disorders
Autism & perinatal problems
Figure 6 – activity with increasing repetition
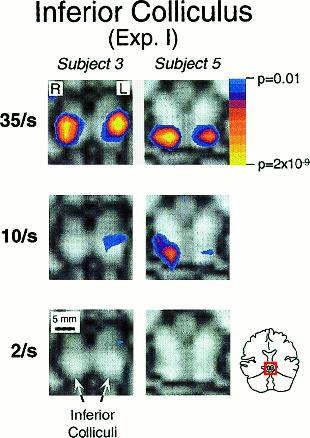
Figure 6: Activation of the inferior
colliculi by noise burst trains with
repetition rates of 2, 10, or 35/s.
Regions are colored according to the
result of a t-test comparison of image
signal strength during “train on” and “off”
periods. Blue and yellow correspond to
the lowest (P = 0.01) and highest (P = 2
X 10-9) significance levels, respectively.  
(Areas with P > 0.01 are not colored).
From Harms & Melcher, 2002.
<<<
back
Home
Research Proposal